
.
[This page is a work in progress. All data displayed is current, but I still have more information, links, and explanations to add, as well as clean up the format. Please bear with me.]The Soil Data provided on this page is made possible by the generous folks at Davis Instuments [link] and Sierra Communications [link]. They have provided a Davis Wireless Leaf & Soil Moisture/Temperature Station [link] for my testing and review. Thanks for allowing us to experiment with this equipment, and hopefully provide useful information for our own garden as well as for our readers.
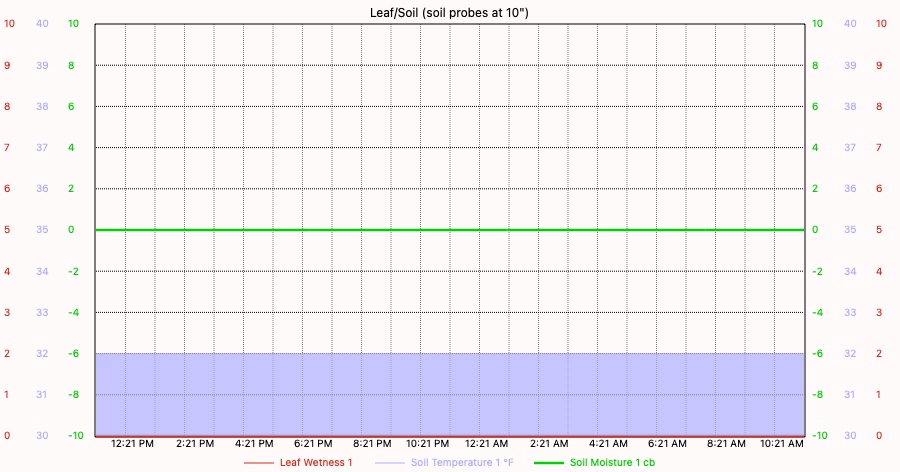
This 24 hour graph shows readings for the Davis Leaf Wetness and Soil Temperature and Moisture Station. The Soil Temp and Moisture probes
are buried 10" deep in our vegetable garden in sandy loam soil. The Leaf Wetness Sensor is mounted 14" above the ground facing north.
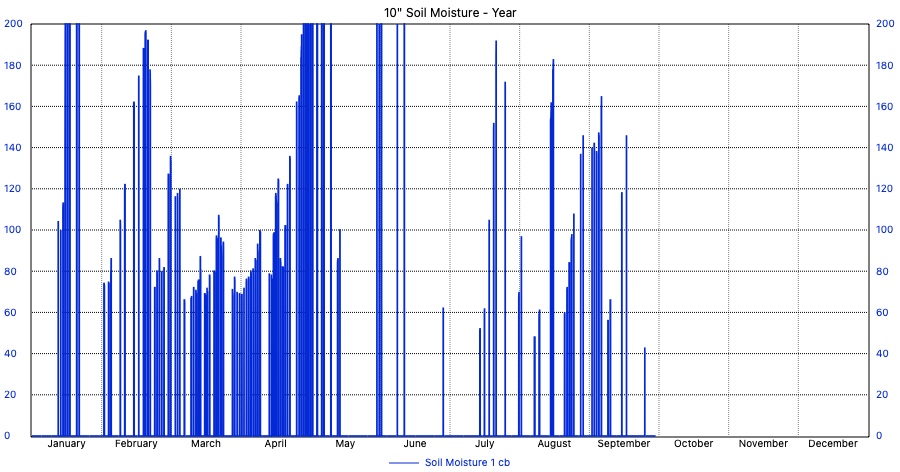
And this is the 10" deep Soil Moisture Sensor over a year's time
(Spikes during winter should be ignored, as sensor doesn't report accurately below freezing)
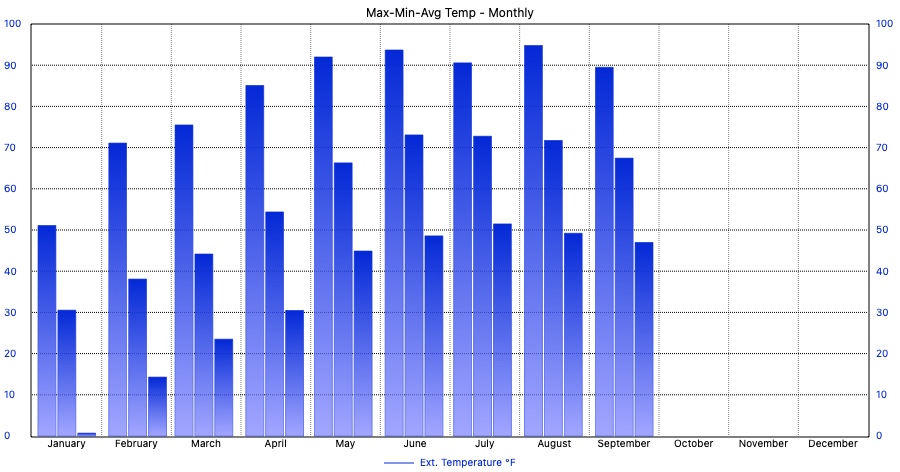
This is a monthly graph comparing maximum, minimum, an average external temperatures.
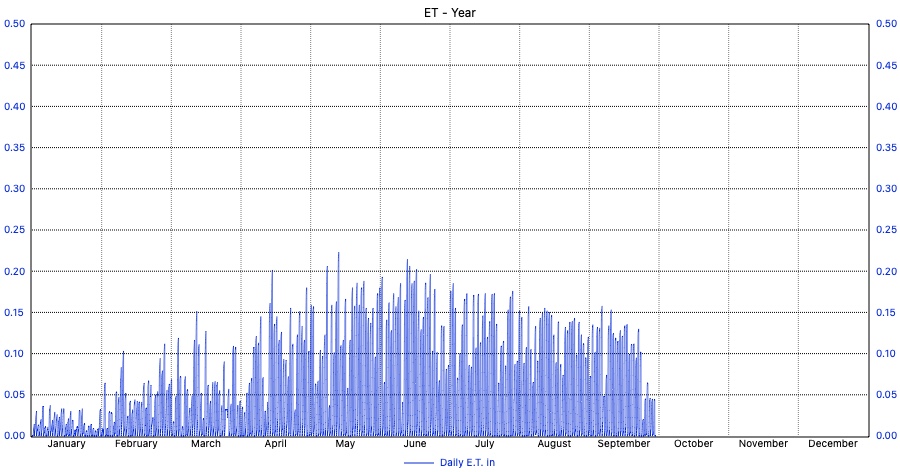
This is a yearly graph showing evapotranspiration (ET).
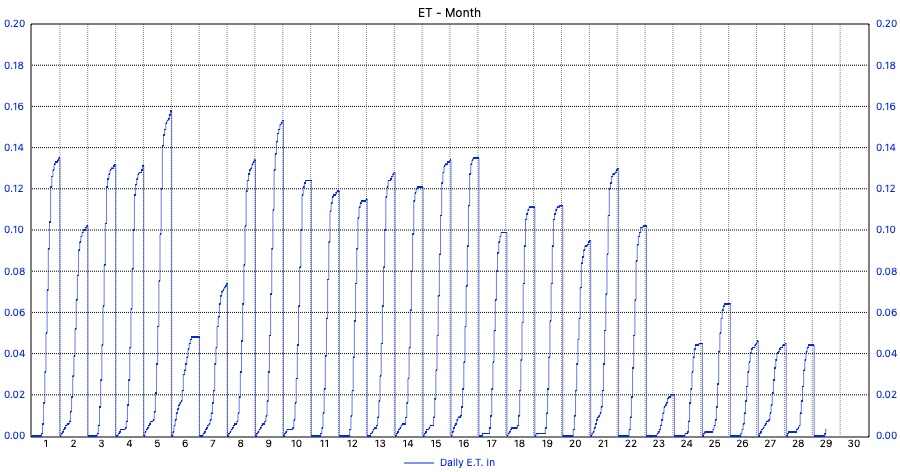
This is a Monthly graph showing evapotranspiration (ET).
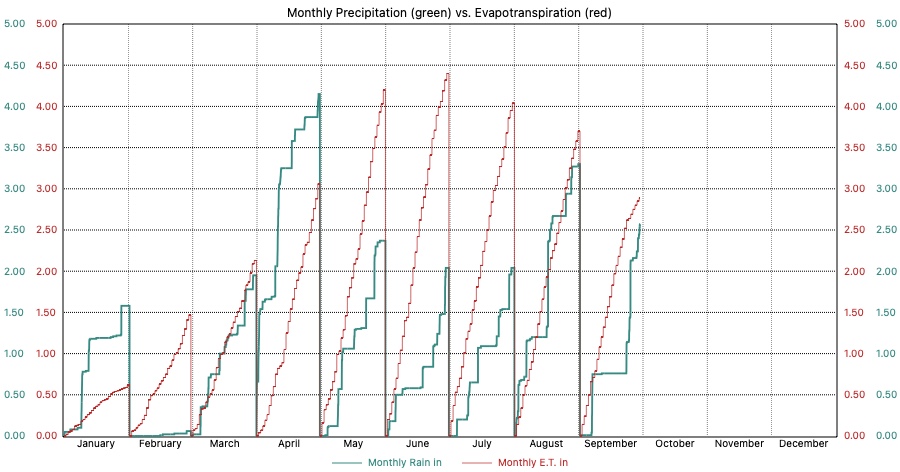
Here is a graph showing evapotranspiration overlayed with the precipitation for each month. You can easily see which months we were behind on rain.
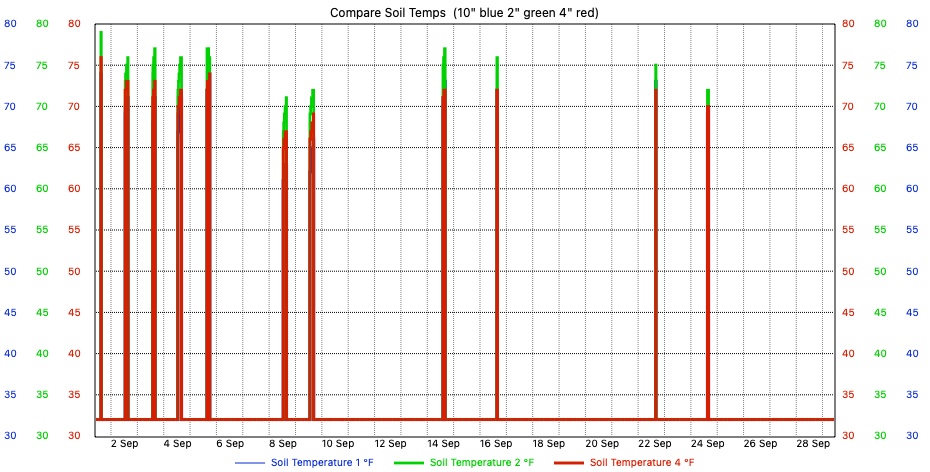
Soil Temperature Comparison:
Probe #1 (blue) is buried 10" deep in the vegetable garden as noted above. Current reading: 32.0 degrees F
Probe #2 (green) is buried 2" deep in the open grass lawn three feet from any garden beds. Current reading: 32.0 degrees F
Probe #4 (red) is buried 4" deep in the open grass lawn three feet from any garden beds. Current reading: 32.0 degrees F
Soil Moisture Comparison:
Sensor #1 (blue) is buried 10" deep in the vegetable garden as noted above. Current reading: 0 Centibars
Sensor #2 (green) is buried horizontally 2" deep in the open grass lawn three feet from any garden beds. Current reading: 0 Centibars
Sensor #4 (red) is buried horizontally 4" deep in the open grass lawn three feet from any garden beds. Current reading: 0 Centibars
Note that the soil moisture readings (centibars) are inverted. A reading of zero is soaking wet and 200 is bone dry. So as the precipitation increases, the soil moisture reading should decrease. (Spikes during winter should be ignored, as sensor doesn't report accurately below freezing)
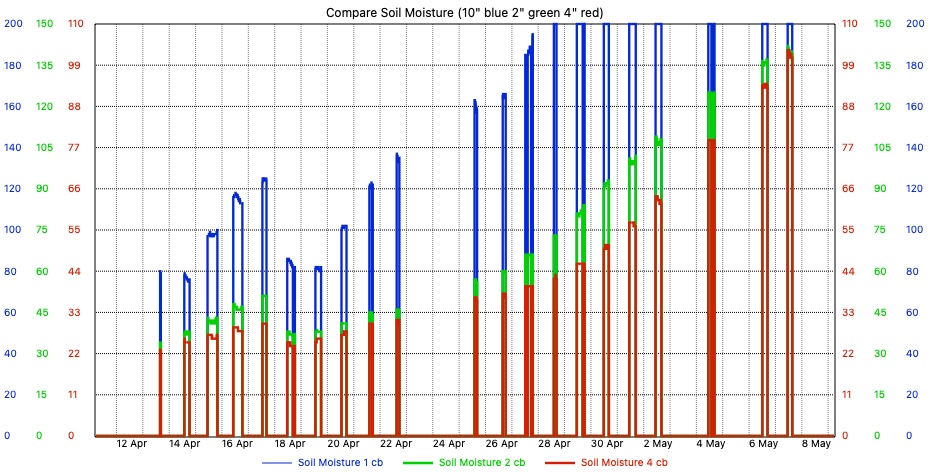
Note: Our location is on one of the ancient glacial beaches, so our soil is very sandy. In over 20 years living here, we've never had standing water in the yard from rain. So our soil moisture tends to be higher numerically (drier) than would be typical in soil with more clay content.
avon-weather.com is privately owned and operated, and is not affiliated with the City of Avon, Ohio, or any business or governmental entity.This data is provided as a hobby from a personal weather station, and while regularly verified for accuracy, you should not base important decisions on this or any weather information obtained from the Internet. For the most current and accurate weather information for your area tune to your local TV or Radio Stations or your official National Weather Service forecast.